August reshapes native traffic through seasonal shifts in user behavior, demand and advertising costs.
Picture this: it’s August, and you open your campaign dashboard. Traffic is still coming in, but something feels off. CPC has shifted, conversions are less predictable and one GEO has quietly slowed down while another keeps performing like nothing changed. Is it campaign fatigue, a traffic quality issue, or just August being August?
Summer changes how people spend their time online. Vacations disrupt routines, browsing moves between devices and seasonal interests start shifting towards back-to-school and early fall. These shifts show up directly in native campaign metrics, often before media buyers notice the cause.
So what should media buyers actually expect from August traffic? We looked at recurring seasonal patterns and available market data for 2026 to find out.
Where Does August Show Up in the Numbers?
August shows up as a cluster of small shifts that, together, change how a campaign reads:
- Traffic volume softens as daily routines break down (vacations, travel, shifted schedules).
- Conversion rates get less predictable, especially in categories with longer purchase decisions.
- Device behavior shifts, with mobile continuing to be an important touchpoint as people spend more time away from their usual desktop screens.
- Auction dynamics move too, as activity slows in some categories, competition eases and pockets of cheaper inventory open up.
None of these shifts move in the same direction across every GEO, vertical or device. That's exactly why broad "August benchmarks" are of limited use. To achieve any real answers, one must examine the full campaign from CPC to conversion.
August 2024: Costs Moved in Different Directions
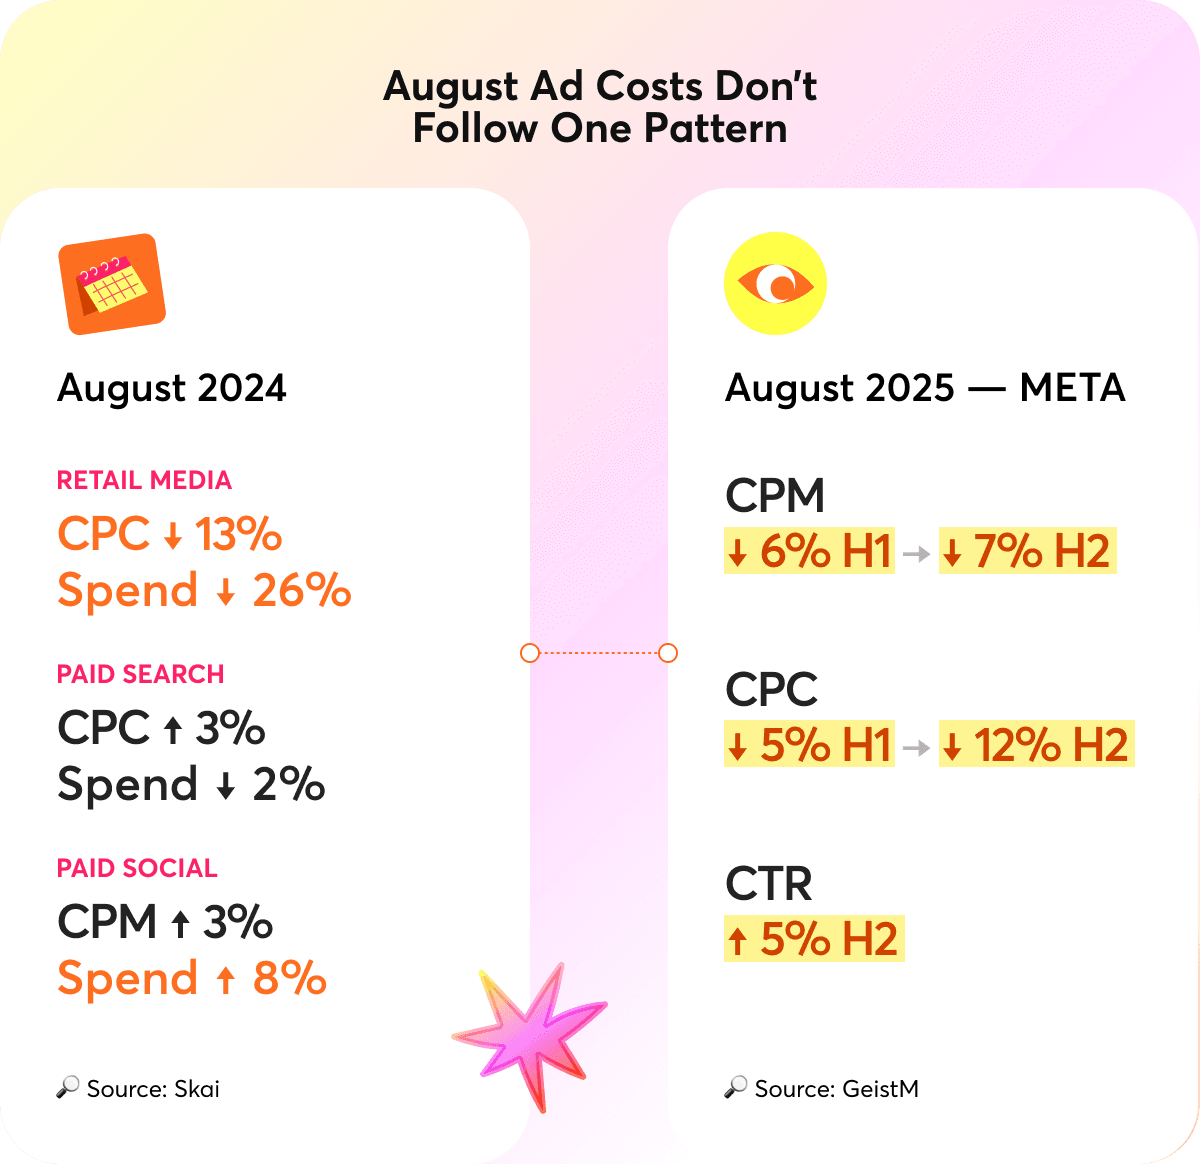
Data from Skai illustrates how uneven these seasonal movements can be.
- Retail media: spend ↓ 26%, CPC ↓ 13%
- Paid search: spend ↓ 2%, CPC ↑ 3%
- Paid social: spend ↑ 8%, CPM ↑ 3%
These three channels tell three completely different stories. In fact, spend and cost didn't even move in the same direction within the same month.
August 2025: Paid Social Costs Eased
A year later, paid social showed another pattern. According to GeistM, Meta CPM decreased throughout the month: down 6% in the first half of August, then a further 7% in the second half. CPC followed a similar curve. CTR also increased in the second half of the month, bringing lower traffic costs together with stronger engagement as August progressed.
- Meta CPM: ↓ 6% (H1) → ↓ 7% (H2)
- Meta CPC: ↓ 5% (H1) → ↓ 12% (H2)
- CTR: ↑ 5% (H2)
At the market level, U.S. digital advertising grew 8% year over year in August 2025, even as total media spend declined 3%.
Where Does August Attention Go?
Seasonality rarely affects every vertical in the same way. In August, the more useful question is where user attention is moving and which needs become more immediate as summer starts winding down.
| Vertical | August angle to explore |
|---|---|
| Travel & leisure | Last-minute trips, local activities, outdoor experiences |
| Education | Back-to-school, courses, professional training |
| Beauty & wellness | Skincare, recovery, getting back into routine |
| Home & lifestyle | Seasonal refresh, home projects, preparation for fall |
| Finance | Budgeting, upcoming expenses, problem-led offers |
| E-commerce | End-of-summer demand, seasonal products, early fall needs |
Timing matters as much as vertical. Early August still runs on summer intent: travel, leisure, spontaneous purchases. By its final weeks, school, work and fall planning move back into focus, and creatives that lean on summer start to feel out of sync.
The angle that worked on August 1 is not guaranteed to work on August 25.
This shift matters most for campaigns with longer decision cycles, like B2B offers and high-ticket purchases. A user can click, engage and show real interest in August, then park the decision until September routines return. Same-day conversion can therefore give an incomplete picture of August traffic in categories where the path to purchase naturally takes longer.
What Is Shaping August 2026?
Advertisers are entering this August after a strong quarter for digital ad spending.
According to Skai, Q2 2026 spend increased year over year across its three major digital channels: 26% in retail media, 26% in paid social and 17% in paid search.
The paid social numbers stand out with spend up 26% while CPC actually fell 18%. That combination (more money in the channel, but cheaper per click) points to a market getting more efficient.
For native buyers, these figures suggest an active performance advertising environment heading into the second half of the year, with budgets, clicks and costs developing differently across channels.
Three factors are especially worth watching through August:
- Performance pressure: CPA, ROAS and measurable post-click results continue to shape buying decisions.
- Faster creative cycles: AI tools make it easier to produce and iterate seasonal concepts.
- Q4 testing starts early: Publisher IDs, headlines, visuals and prelanders tested now can generate useful signals before competition intensifies later in the year.
However, as of August 10, it is still too early to call an August 2026 traffic trend. But the transition later in the month may tell us much more.
Your August Dashboard: What Deserves a Second Look?
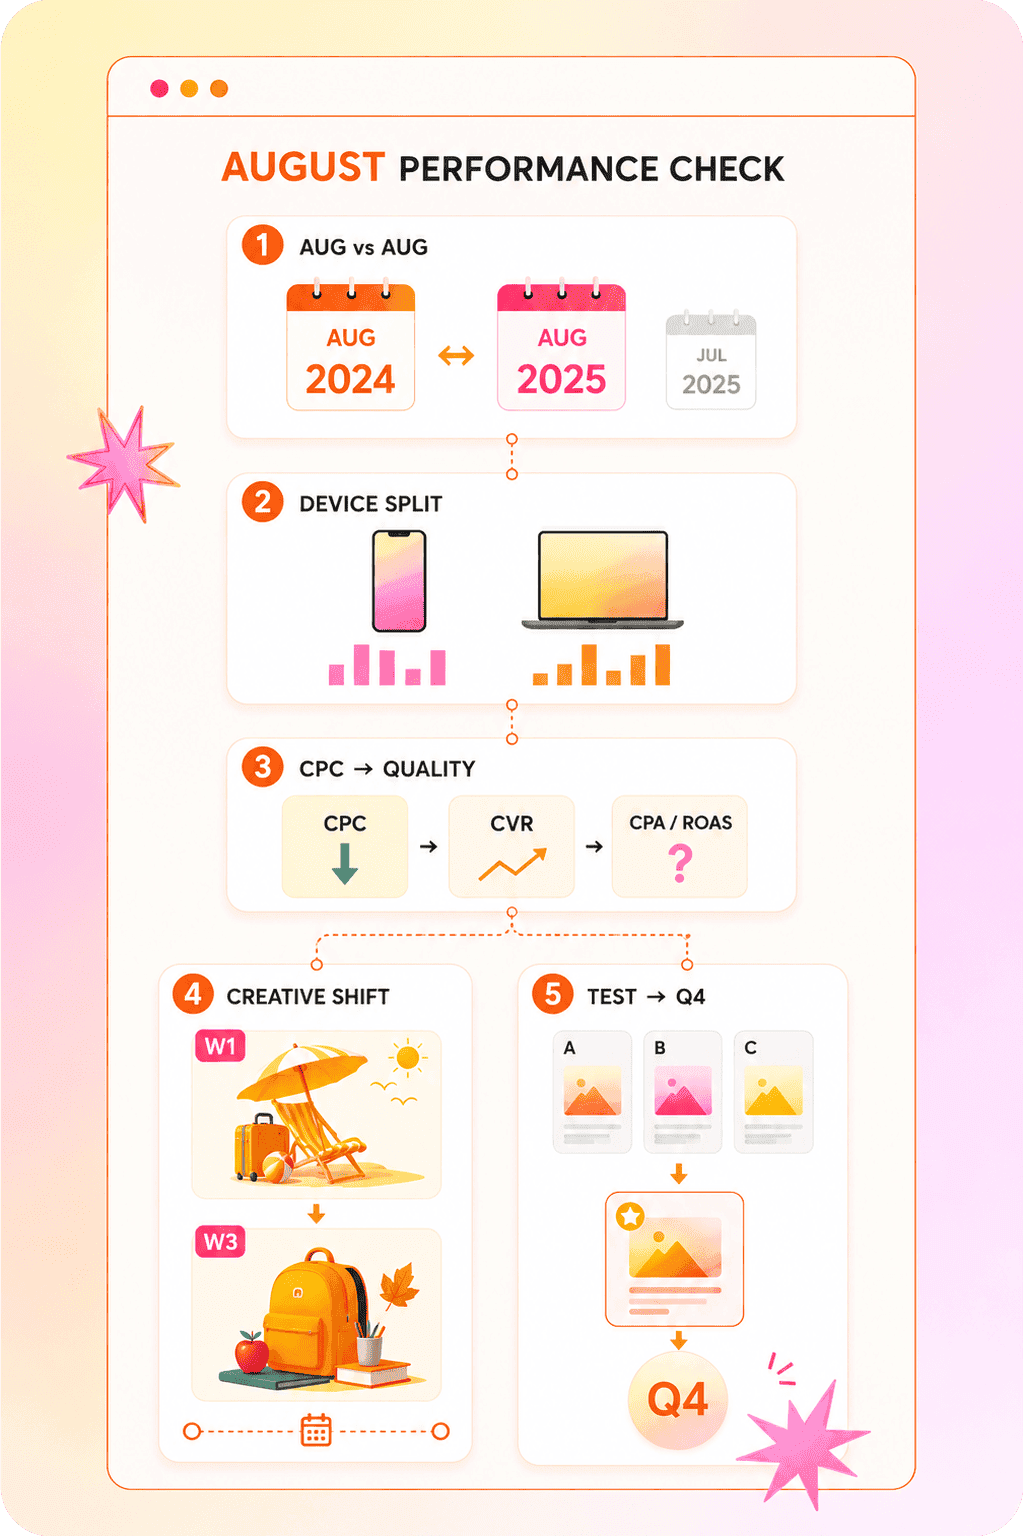
August can make familiar metrics harder to read in isolation. Before adjusting budgets or pausing campaigns, a few checks can help you identify a genuine seasonal shift from an actual performance problem:
- Compare August with August: Month-over-month changes can exaggerate seasonality. Check the same period in 2025 where historical data is available and use July as additional context.
- Split the picture by device: Look at mobile and desktop separately. Changes in browsing routines can affect traffic volume, engagement and conversion behavior differently across devices.
- Follow cheap clicks beyond CPC: A lower CPC becomes useful when the traffic holds up further down the funnel. Check engagement, conversion rate and CPA or ROAS before increasing spend.
- Refresh the angle with the calendar: Creative that leans on summer activities and travel in week one should shift toward back-to-school and fall preparation by week three.
- Keep the tests that can teach you something for Q4: August is a useful window for testing publisher placements, prelanders, headlines and visuals. Log which combinations drive quality conversions so the strongest signals are ready when fall scaling begins.
August Is Already Pointing to Fall
By late August, the advertising calendar starts moving forward. Back-to-school campaigns are in full swing, routines return and Q4 planning stops being theoretical.
For native media buyers, August offers a useful window into how creatives, publishers and offers perform as user intent shifts and Q4 gets closer. The campaigns that read these signals will go into fall with data instead of guesswork.
The full picture for August 2026 will only become clear once the month is complete. Until then, go back to your dashboard and ask one more question before reacting: what is actually driving the change? Seasonality, device mix, audience intent, traffic costs and conversion lag can all leave their mark on August performance. Watch the shifts, test with purpose and keep the data worth carrying into the next season.