Data updated: August 2026.
100,000 pageviews can be worth a few hundred dollars to one publisher and several thousand to another. The interesting part is everything that happens between the pageview and the payout.
I’ve looked at enough publisher revenue numbers to be suspicious of anyone who answers this question with a single RPM.
Two websites can have the same traffic and completely different ad businesses. One has mostly US readers, strong advertiser demand and pages people actually stick around on. The other gets cheaper traffic, serves fewer viewable impressions and wonders why the calculator it found online promised twice the revenue.
So, instead of giving you one suspiciously neat “average”, we’ll start with realistic 2026 earnings ranges, then unpack what moves a website toward the bottom or the top of them.
- How Much Can a Website Make From Ads?
- How Website Ad Revenue Is Calculated
- Why Two Websites With the Same Traffic Can Earn Very Different Amounts
- Website Ad Revenue by Niche in 2026
- How Ad Rates Change Throughout the Year
- What Can a Small Website Realistically Earn From Ads?
- Have Website Ad Rates Changed Since 2024?
- How to Increase Your Website Ad Revenue
- Ad Networks vs Direct Sales: Which Pays More?
- Website Ad Revenue FAQ
How Much Can a Website Make From Ads?
Let’s get to the number first. If you know your monthly pageviews and Page RPM, the basic revenue math is easy. The harder part — and the part that catches publishers out — is deciding which RPM is actually realistic for your site.
For planning purposes, broad publisher benchmarks tend to start in the low single-digit Page RPM range, while sites with valuable niches, Tier-1 audiences and stronger monetization setups can earn considerably more. So rather than pretending there’s one useful “average”, here’s a range to work with.
| Monthly pageviews | At $3 Page RPM | At $8 Page RPM | At $15 Page RPM |
|---|---|---|---|
| 10,000 | $30 | $80 | $150 |
| 25,000 | $75 | $200 | $375 |
| 50,000 | $150 | $400 | $750 |
| 100,000 | $300 | $800 | $1,500 |
| 500,000 | $1,500 | $4,000 | $7,500 |
| 1 million | $3,000 | $8,000 | $15,000 |
Broad mixed-site RPMs often sit in the low single digits, while Tier-1 traffic, high-value niches and well-optimized monetization can push rates substantially higher. The same number of pageviews can therefore produce very different revenue.
At a $5 Page RPM, 100,000 monthly pageviews generate roughly $500. Get that Page RPM to $15 and the same 100,000 pageviews generate $1,500 without adding a single visitor.
So it pays to be wary of focusing exclusively on the next traffic milestone. Sometimes another 50,000 pageviews are exactly what you need. Sometimes there’s more money hiding in the 100,000 you already have.
Before we get into why that spread is so large, it helps to clear up one thing publishers regularly trip over: Page RPM, ad RPM and CPM are not the same number.
How Website Ad Revenue Is Calculated
Ad revenue comes with an impressive collection of acronyms, and unfortunately, mixing up just two of them can make an earnings benchmark look much better — or worse — than it really is.
For this article, Page RPM is the number to watch because it answers the most useful publisher question: how much revenue does every 1,000 pageviews generate?
| Metric | What it measures | Useful for |
|---|---|---|
| Page RPM | Publisher earnings per 1,000 pageviews | Estimating what your website traffic earns |
| Ad RPM | Publisher earnings per 1,000 ad impressions | Comparing the performance of ad inventory |
| CPM | Cost advertisers pay per 1,000 ad impressions | Understanding advertiser demand and pricing |
Not every publisher deal is CPM-based, either. Some inventory may earn on a CPC basis, while direct advertiser agreements can use flat fees or custom pricing. Page RPM is still useful because it rolls the resulting revenue back into one comparable pageview-based metric.
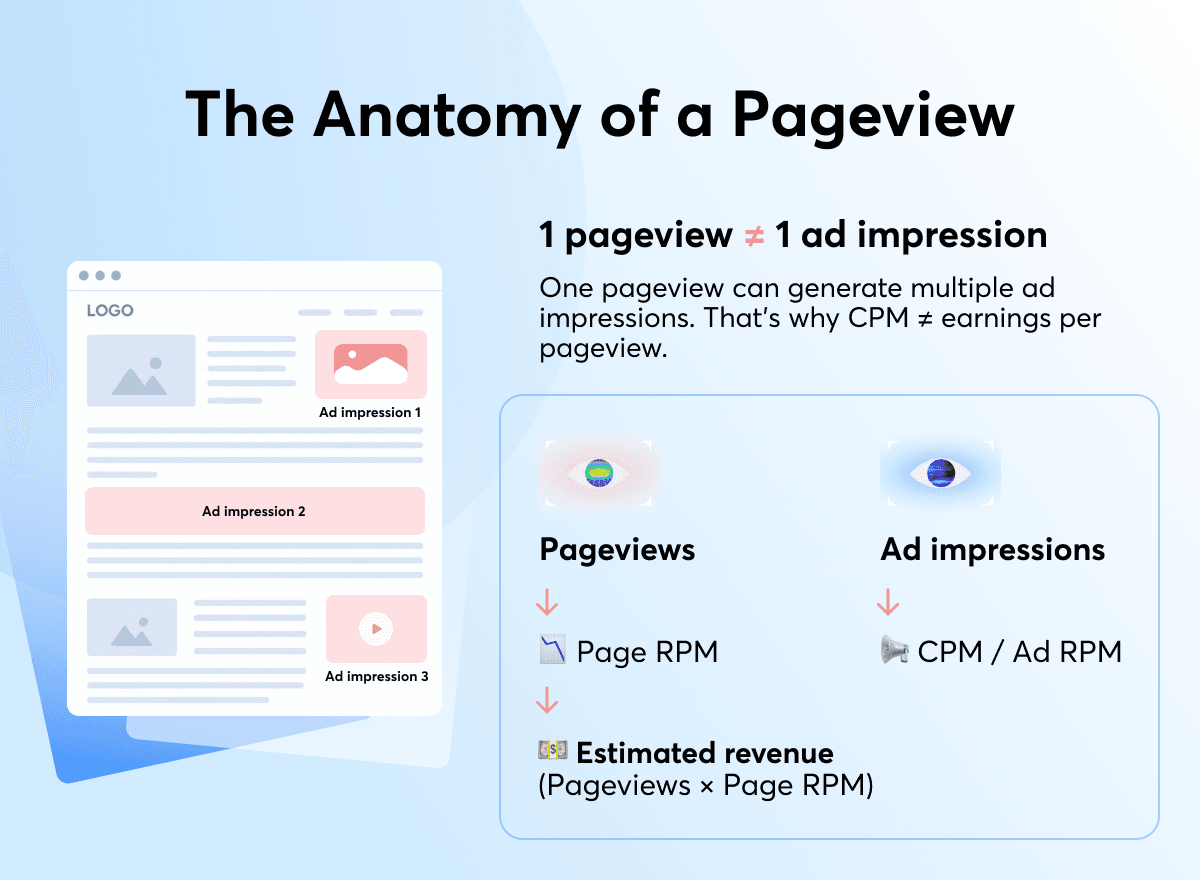
The distinction matters because one pageview can generate several ad impressions.
Imagine a visitor opens one article containing three monetized ad placements. That’s one pageview, but potentially three ad impressions. So a $5 CPM does not mean that 1,000 pageviews will earn you $5. I’ve seen this mix-up produce some wonderfully optimistic revenue forecasts.
How to Calculate Website Ad Revenue
For a quick pageview-based estimate, the formula is:
So, if your site gets 250,000 pageviews per month at a $7 Page RPM:
Most ad platforms calculate these metrics for you, but knowing the formula makes it much easier to sanity-check benchmarks and revenue forecasts.
The real challenge is increasing Page RPM from $3 to $7, $15 or beyond.
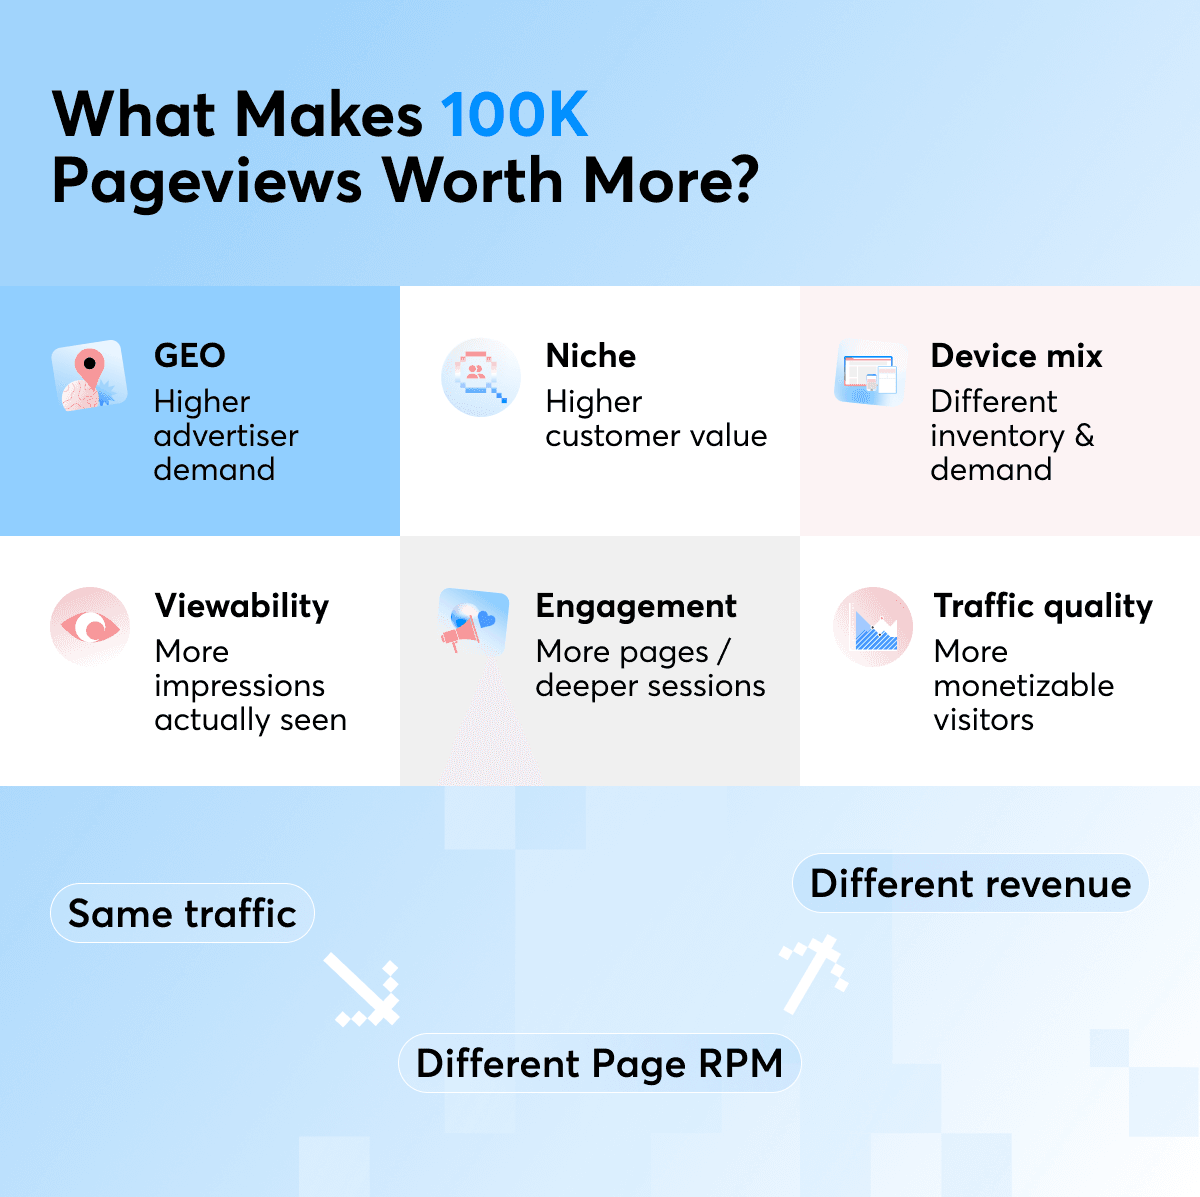
And that's where websites with identical traffic numbers start pulling apart: GEO, niche, device mix, ad density, viewability and traffic quality can all change what those 1,000 pageviews are actually worth.
Why Two Websites With the Same Traffic Can Earn Very Different Amounts
This is where ad revenue gets more interesting than pageviews × RPM.
It's a common trap: two publishers compare earnings, notice similar traffic and immediately assume something's broken in their ad setup. Sometimes it is. Quite often, they’re comparing two audiences that advertisers value very differently.
Before blaming the ad network, check these variables first.
GEO
Where your visitors live can have an enormous effect on what advertisers are willing to pay to reach them.
Traffic from markets such as the US, UK, Canada and Australia generally attracts stronger advertiser demand than traffic from lower-spend markets. That means two English-language sites with identical pageviews can still end the month with very different RPMs simply because their audience geography is different.
And averages can hide this surprisingly well. Look at the actual country mix within your international traffic.
Niche
A pageview about mortgage refinancing and a pageview about celebrity news aren't equally valuable to advertisers.
Industries where a new customer can be worth hundreds or thousands of dollars — finance and B2B software are obvious examples — tend to support stronger advertising rates. Broad entertainment and general-interest content often operates on thinner economics.
We'll look at current niche benchmarks separately below, because this factor deserves actual numbers rather than a vague “some niches pay more.”
Device Mix
Mobile may deliver most of your traffic while desktop quietly delivers a disproportionate share of your ad revenue.
Screen size affects how much inventory is available, which formats work well and how users interact with the page. Advertiser demand can differ by device too.
So when RPM moves unexpectedly, check whether your device mix moved with it. A traffic spike isn't automatically a revenue spike if most of those new visits monetize differently from your usual audience.
Ad Density and Placement
More ads create more inventory. They can also create a worse website.
The key question is how much monetizable inventory the page can support without hurting viewability, speed or the reader experience.
Placement matters here too. An ad technically loaded at the bottom of a page that few people reach isn't equivalent to a viewable placement inside engaged content.
If you want to go deeper into that part of the equation, our guide to ad placement covers formats, positions and optimization in detail.
Viewability and Engagement
An ad impression isn't particularly valuable if nobody had a realistic chance to see it.
Readers who scroll, spend time with the content and move through multiple pages can create more viewable inventory than visitors who arrive and bounce almost immediately. That's one reason traffic quality and ad performance are so closely connected.
Traffic Source and Quality
Not all 100,000 pageviews arrive with the same behaviour.
Search visitors, direct readers, newsletter subscribers and social traffic can differ in session depth, engagement, geography and return frequency. Invalid traffic, bots, ad blockers and users who don't consent to advertising can also reduce the share of traffic you can actually monetize.
This is increasingly important enough that publisher platforms are distinguishing between total traffic and monetizable traffic rather than treating every session as equally valuable.
When your RPM falls outside a benchmark range, start by looking at the audience behind the number.
Website Ad Revenue by Niche in 2026
Niche matters, but not quite in the way those “highest-paying website niches” lists make it sound.
A finance site doesn't automatically earn a $30 RPM because someone selected Finance in the CMS. Advertisers pay more when the audience is commercially valuable to them, and some topics naturally attract more of those high-value moments.
Current publisher benchmarks give us a useful sense of the spread:
| Niche | Indicative Page RPM | Why advertiser demand differs |
|---|---|---|
| Finance | $20–$45+ | High customer value across credit, insurance, investing and financial services |
| Health & wellness | $5–$18 | Strong commercial demand across products and services |
| Technology & SaaS | $5–$12+ | Valuable software customers and B2B leads |
| E-commerce | $3–$10 | Strong purchase intent but wide variation by product category |
| Travel | $3–$9 | Valuable bookings combined with strong seasonality |
| News & current events | $2–$7 | High traffic potential but broader commercial intent |
| Lifestyle & entertainment | $1.50–$5 | Broad audiences with generally lower advertiser value |
Read the ranges as direction. A finance site with mostly US traffic and a finance site with a global audience can sit surprisingly far apart. GEO, traffic source, seasonality, viewability and the ad setup can move an individual publisher well outside these ranges.
Finance is the clearest example of why niche can matter so much. A bank, insurer or investment platform may be willing to spend considerably more to acquire a customer than an advertiser selling a low-cost consumer product. That value works its way back through the advertising ecosystem.
But I wouldn't choose a content strategy based on RPM rankings alone. I've seen highly specific sites outperform supposedly “premium” niches simply because they attracted a better-defined audience and gave advertisers more valuable inventory.
And there's another variable that these annual benchmark tables tend to hide particularly well: when those impressions were sold. Ad rates don't sit still from January to December.
How Ad Rates Change Throughout the Year
If your RPM drops in January after a great December, don't panic. Your website probably didn't suddenly become worse at making money.
Advertising has a calendar. Advertiser demand typically cools after the holiday spending rush, making Q1 one of the softer periods for publisher revenue. Budgets begin rebuilding as the year progresses, while Q4 often brings the strongest demand as brands compete for holiday shoppers and year-end conversions.
A simplified year can look something like this:
| Period | Typical ad demand | What publishers may see |
|---|---|---|
| Q1 | Lower | RPMs often fall after the holiday peak |
| Q2 | Recovering | Demand and rates begin to stabilize |
| Q3 | Building | Back-to-school and early seasonal spending can lift demand |
| Q4 | Highest | Holiday budgets and competition can push rates up |
That pattern isn't identical for every site. A travel publisher may have a very different peak from an e-commerce or finance site, and geography adds another layer of seasonality.
This pattern causes unnecessary optimization more often than it should. A publisher sees RPM fall, starts moving placements and adding units, then rates recover partly because advertiser demand recovered anyway. Now it's difficult to tell whether the changes actually helped.
So, keep seasonality in the benchmark. RPM only becomes meaningful in context: niche, GEO and date.
What Can a Small Website Realistically Earn From Ads?
This is where percentages and RPM benchmarks meet a slightly less exciting thing: actual dollars.
A small site can have a perfectly healthy RPM and still make modest ad revenue. At a $6 Page RPM, for example:
- 5,000 monthly pageviews = about $30
- 10,000 pageviews = about $60
- 25,000 pageviews = about $150
- 50,000 pageviews = about $300
Nothing is necessarily wrong with those numbers. You’re just multiplying a reasonable rate by a relatively small amount of inventory.
It’s easy to start tweaking ad placements when the first $50 or $100 feels disappointing. But if the RPM is already competitive for the niche and audience, growth or an additional revenue stream may have more upside than squeezing out another dollar.
That’s why I’d separate two questions:
- Is my website monetizing its traffic well? Look at RPM, viewability and revenue per visitor.
- Is my website generating enough total ad revenue? Now traffic volume matters much more.
A site can be doing the first very well and still not have enough scale for the second.
A $100 month at a healthy RPM tells a very different story from the same $100 earned on ten times the traffic.
Advertising doesn't have to carry the whole business while traffic is still growing. Affiliate revenue, products, sponsorships or memberships can monetize reader behaviours that ads don't, which is why smaller publishers often benefit from building a broader monetization mix rather than waiting for pageviews to do all the work.
Have Website Ad Rates Changed Since 2024?
Yes, but not in a way that gives us a neat “2024 RPM vs. 2026 RPM” number for the entire web.
Publisher results have moved differently depending on audience, niche, platform and ad setup. For example, Raptive reported that its creators saw 18% higher average RPM year over year in January 2025, while individual publisher optimization cases have produced double-digit RPM gains without equivalent increases in traffic.
That last part matters. Some of the improvement since 2024 hasn't come from advertisers simply paying more. Publishers and monetization platforms have also become better at extracting value from the traffic already there, through stronger demand competition, better viewability, smarter ad loading and more efficient layouts.
So I’d be careful with charts claiming something like: 2024 average RPM: $X → 2026 average RPM: $Y
Unless the same publisher cohort, markets, niches and methodology sit behind both numbers, the comparison looks much more precise than it really is.
RPMs aren't static. Your 2024 RPM may no longer reflect what the same traffic can earn today. Changes in advertiser demand, audience mix and monetization technology can make an older setup underperform even when pageviews remain healthy.
For publishers, that’s a more actionable comparison anyway: not “Did the internet’s average RPM go up?” but “Is my site earning as much from its current audience as it reasonably could?”
That brings us to the part of the equation you can actually work on.
How to Increase Your Website Ad Revenue
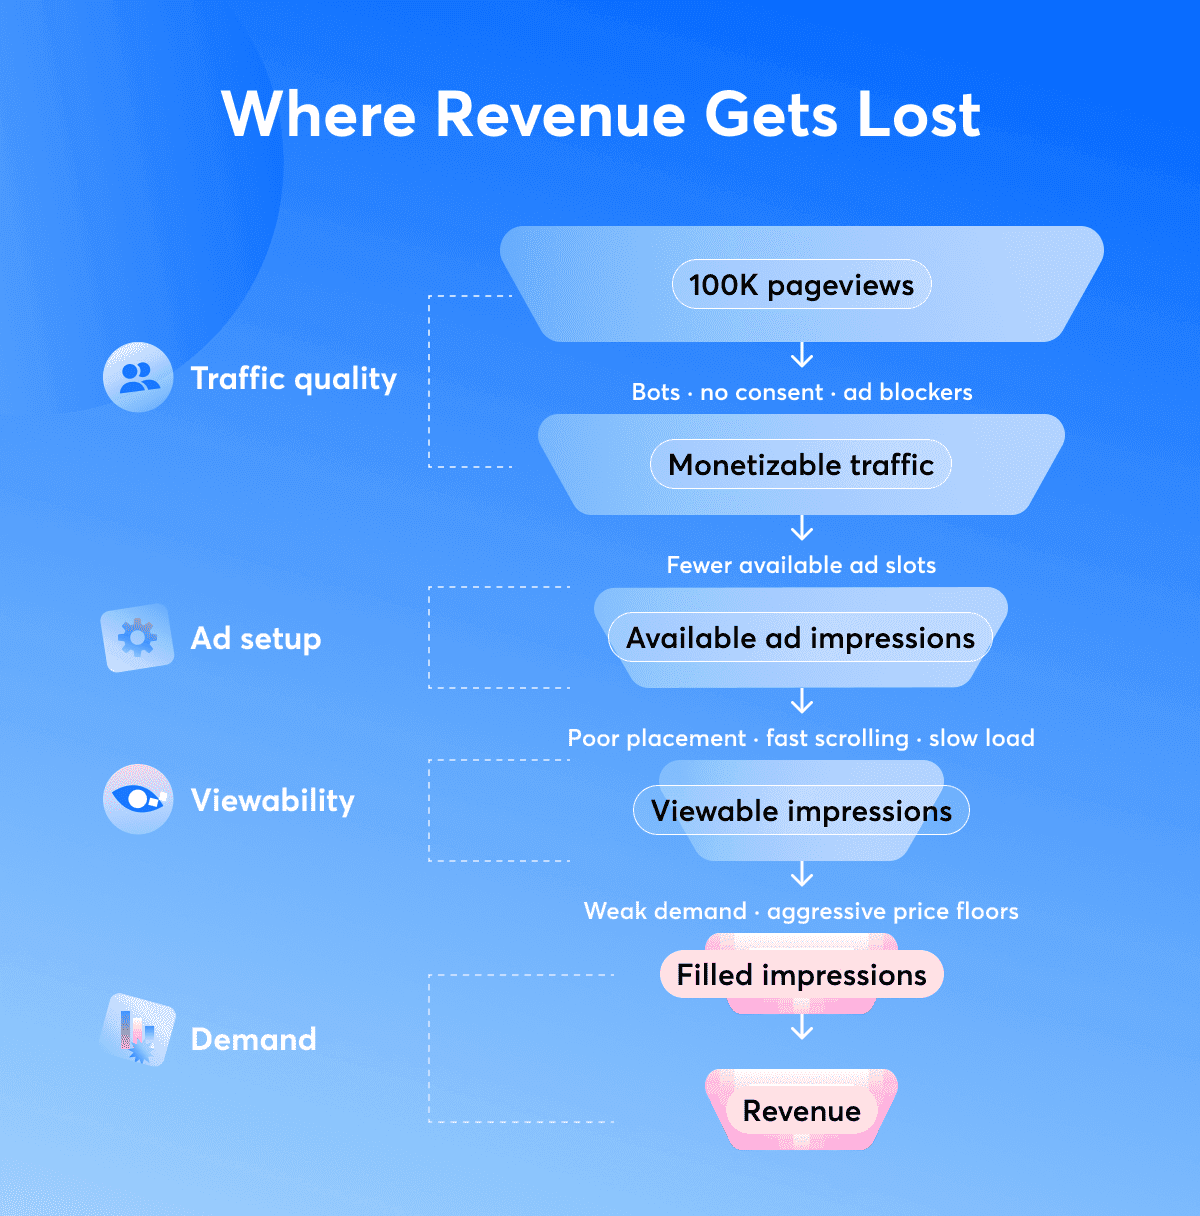
Once you know your RPM, the obvious temptation is to chase a higher one. I’d start somewhere slightly different: find out where your existing pageviews are failing to turn into valuable ad impressions.
Sometimes the problem is demand. Sometimes it’s placement. Sometimes readers simply leave before half the ads have a chance to load.
Improve Viewability Before Adding More Ads
An ad that loads somewhere nobody reaches isn't doing much for you.
Start by identifying placements with poor viewability and asking why. Are they too far down the page? Do they load too slowly? Are readers scrolling past them before the creative appears?
Google recommends placing ads around content-rich areas, improving page and ad load speed and using techniques such as lazy loading for below-the-fold inventory.
But there’s an interesting catch: don't chase perfect viewability either. Playwire’s 2026 publisher data found that sites in the 80–90% viewability range generated higher median revenue per session than those above 90%. Push one metric too far and you may sacrifice inventory or fill somewhere else.
Optimize the Pages That Already Carry the Business
You probably don't need to start with every URL on the site. Pull your highest-traffic and highest-revenue pages and compare them. If one article generates 10% of pageviews but 25% of ad revenue, figure out what makes it different. Page depth? GEO? Device mix? Better placements? More viewable impressions?
Then look at the opposite group: high traffic, surprisingly low revenue. Those pages are often where the easiest opportunities are hiding.
Compare RPM across your main page types or content sections. A healthy site-wide average can hide both strong performers and pages that drag the average down.
Test Ad Density, Don't Just Increase It
More inventory can mean more revenue. Current data supports that more strongly than publishers sometimes expect.
Playwire's 2026 analysis found impressions per pageview to be the strongest predictor of revenue per session among the metrics it tested. Publishers above the median for both page depth and ad density generated substantially more revenue per session than those below both. That still isn't permission to fill every gap with another rectangle.
Test additional inventory against RPM, revenue per session, page depth, viewability and user behaviour. The goal is to find the point where another impression adds value without making the site worse enough to lose it elsewhere.
Improve Page Speed and Ad Load Speed
A slow ad can technically exist on the page and still miss the reader completely. If someone scrolls past a placement before the creative renders, you’ve created inventory without much monetization value. Google specifically connects faster page and ad loading with better viewability and recommends responsive formats and appropriate lazy loading.
So before blaming CPM, check:
- page load performance;
- ad rendering time;
- unnecessary third-party scripts;
- lazy-loading behavior;
- mobile performance.
Improving site speed can benefit both user experience and revenue.
Create More Competition for Your Inventory
Who gets the opportunity to bid on your inventory can have a significant impact on RPM.
A stronger demand setup can increase competition for impressions, whether through additional demand partners, programmatic auctions, native demand or eventually direct advertiser relationships.
But higher CPM alone shouldn't become the goal. Playwire found that publishers using aggressive floors achieved CPMs 2.5 times higher yet earned 19% less revenue per session, largely because they sacrificed fill.
That’s a useful reminder: the highest bid means very little if too much of your inventory goes unsold.
Get More Value From Your Traffic
Finally, go back to the audience. Another 100,000 visits aren't equally useful if they come from lower-value GEOs, bounce immediately or can't be effectively monetized. More valuable growth comes from attracting readers advertisers want to reach and giving those readers reasons to consume more than one page.
Watch revenue per visitor or session as traffic grows, too. If visits rise while revenue per visitor falls, the new audience may be monetizing differently from the one you already had.
Changes in search behavior can affect that mix as well. AI-powered search results and answer summaries can resolve some queries without a click-through, reducing the share of visibility that turns into ad-monetizable pageviews. That makes older traffic-to-earnings benchmarks less useful unless the underlying traffic mix is comparable.
This is where content, distribution and monetization stop being separate jobs. The goal is sustainable revenue from the audience you have without making that audience regret showing up.
Ad Networks vs Direct Sales: Which Pays More?
Direct ad sales can pay more per impression. Ad networks and programmatic demand are much easier to scale.
That sounds like an obvious win for direct sales until you remember that someone has to find the advertiser, negotiate the deal, deliver the campaign, report on it and convince them to come back.
Fill rate matters as much as price. A higher CPM won’t help much if half your premium inventory sits unsold while you’re looking for buyers.
| Factor | Ad networks / Programmatic | Direct ad sales |
|---|---|---|
| Setup effort | Low–medium | High |
| Sales effort | Low | High |
| Pricing control | Lower | Higher |
| Advertiser access | Broad, automated demand | Publishers find and manage advertisers |
| Revenue per premium placement | Usually lower | Potentially higher |
| Fill potential | High | Depends on sales capacity |
| Best for | Most publishers | Established sites with valuable audiences |
Direct deals tend to work best when you have something specific to sell beyond impressions: a recognizable brand, a valuable niche audience, premium placements or advertiser relationships.
Programmatic takes the opposite approach. Instead of negotiating every campaign yourself, automated demand competes for inventory as it becomes available. That scale is especially useful for publishers that couldn't realistically maintain dozens of direct advertiser relationships.
You Don't Have to Choose One
In practice, the interesting answer is often both.
Sell premium inventory directly where the economics justify the work, then use programmatic or network demand to monetize the rest. Google describes essentially this hierarchy, with direct sales prioritized ahead of different programmatic deal types and open-auction demand.
For smaller publishers, automated monetization is usually the practical place to start. Direct sales become more attractive once you can approach advertisers with a defined audience, reliable traffic and enough inventory to make the deal worth managing.
Website Ad Revenue FAQ
How much do websites make per 1,000 views?
It depends on Page RPM. At a $5 Page RPM, 1,000 pageviews generate about $5; at $15, the same traffic generates about $15. GEO, niche, seasonality and ad setup can move that number considerably.
How many pageviews do you need to make $1,000 from ads?
At a $5 Page RPM, you’d need roughly 200,000 monthly pageviews. At $10 RPM, around 100,000; at $20 RPM, around 50,000. The better your RPM, the less traffic you need to reach the same revenue target.
How much can a website with 100,000 pageviews make?
At $3 Page RPM, roughly $300 per month. At $8 RPM, around $800; at $15 RPM, about $1,500. Think in scenarios rather than expecting one universal payout.
Which website niches have the highest ad rates?
Finance tends to sit toward the top, with technology, SaaS and some health content also attracting strong advertiser demand. But niche alone doesn't determine RPM — audience geography and commercial value can matter just as much.
Can a small website make money from ads?
Yes. There’s no traffic milestone at which advertising suddenly starts working. The catch is scale: even a healthy RPM produces modest absolute revenue when you only have a few thousand monthly pageviews.
Do desktop visitors generate more ad revenue than mobile visitors?
They can, but there’s no universal rule. Screen size, available inventory, advertiser demand, viewability and user behaviour all affect device-level RPM, so check your own reporting before treating desktop or mobile as inherently more valuable.
Is a higher CPM always better for publishers?
No. A higher CPM can come with lower fill and ultimately less total revenue. Playwire’s 2026 publisher dataset found that aggressive-floor publishers had 2.5× higher CPMs but 19% lower revenue per session, which is a good reminder to judge the whole monetization setup rather than one impressive-looking metric.
Pageviews Don’t Tell the Whole Story
You probably came here hoping for a number. Fair enough — now you have a few.
The more useful thing to take away is what sits behind that number. A Page RPM of $5, $10 or $20 is the result of dozens of small things happening at once: who visits, what they read, how long they stay, which ads they actually see and how much advertisers want that audience. That also means your current RPM isn’t particularly sacred. There are levers to pull.
MGID helps publishers work on that equation across native, display and video advertising, with more demand and tools to optimize existing inventory.
So keep the benchmark. Check it again in a few months. Hopefully, by then, your own numbers have made this article out of date.