A report can glow with millions of impressions and still leave almost nothing behind.
Reach is the easiest number in a campaign report to love. It is big, it is clean and it makes scale visible at a glance. It tells you how many doors you knocked on but nothing about whether anyone answered.
Therefore, reach is an incredibly broad metric. It can mean someone noticed a brand for half a second, read the whole article, watched the video to the end or came back three days later to search for the product. Four very different moments, one identical tick in the report.
Discovery makes this harder to see. People meet brands in search, social feeds, publisher articles, creator videos, community threads and AI answers, often several of them before they do anything at all. Much of that influence never reaches the dashboard, leaving the top-line number to tell only part of the story.
The space between being seen and actually responding is the engagement gap. In this article, we will focus on how to find it, and what to do once you have it.
What Reach Can and Can’t Tell You
Reach earns its place because it answers the question: how widely did the campaign travel? It measures scale, coverage, and whether the media budget is putting the brand in front of enough people.
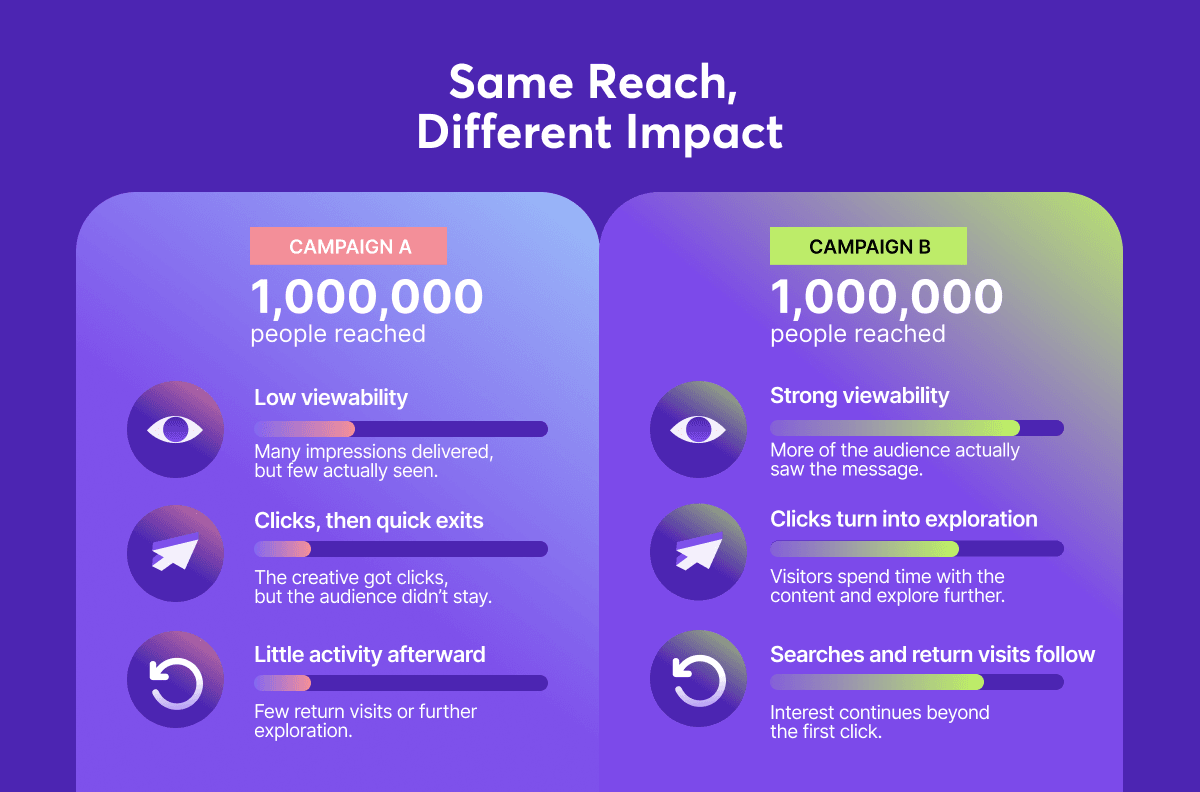
The trouble starts when reach is asked to stand in for impact. Take two campaigns:
- Campaign A: 2 million people reached, little interaction afterward.
- Campaign B: 700,000 people reached, and a far bigger share of them read, watched or clicked through to explore the brand.
Campaign A wins on reach by a wide margin. Although, whether it delivered an impactful campaign is a different question. As mentioned, reach counts exposure, but it doesn’t differentiate between varying levels of attention. For example, reach counts the person who saw the and and searched for the product later and the person who scrolled past the ad without registering it
Discovery Has Become Harder to Follow
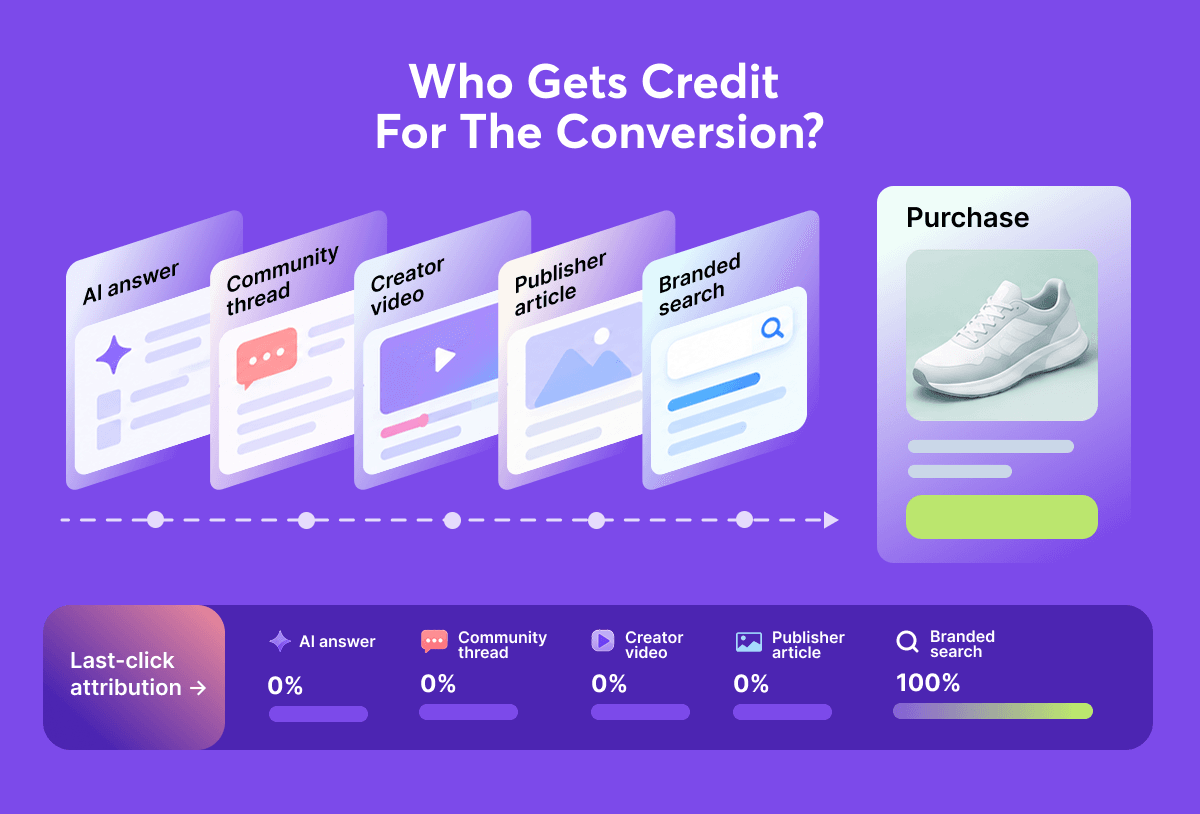
A customer journey can collect quite a few stops before anyone reaches for a credit card. Let’s say someone is shopping for running shoes. They first meet a brand in an AI-generated answer, then spot the same name in a Reddit thread, then watch a creator test the shoes on TikTok and later read a publisher's comparison of several models. Two days on, they type the brand name into Google and buy straight from the website.
That person’s final search gets a tidy conversion. The four earlier encounters may get no credit, even though they most likely helped move the decision along. Oftentimes, branded search is the last signature on a deal that several other channels helped negotiate.
A journey like this makes engagement hard to define into a single quantifiable metric, like clicks or traffic. Some touchpoints spark curiosity, some offer validation and some simply make a brand familiar enough to survive the next round of consideration.
AI-assisted and zero-click discovery add another twist. Answers are increasingly consumed right on the results page or inside an AI interface, which leaves few visible trails back to the sources that shaped the decision.
The numbers show how fast this behavior is adopting across the web. An analysis by SparkToro, based on Similarweb clickstream data, found that 68.01% of US Google searches between January and April 2026 ended without a click, up from 60.45% in 2024.
Google's AI-generated answers push it further. Ahrefs analyzed 300,000 keywords and estimated that AI Overviews were associated with a 58% lower organic click-through rate for the top-ranking page compared with the expected CTR without an AI Overview.
For brands, this creates an awkward measurement puzzle. A missing click can mean either the person ignored the result or they learned enough and carried on elsewhere. Dashboards rarely say which.
| Touchpoint | What the person might be doing | Signal left behind |
|---|---|---|
| AI answer | Discovering options | Mention/retrieval, often no site visit |
| Publisher article | Researching and comparing | Read time, scroll depth, referral |
| Creator or community | Looking for validation | Views, comments, saves, shares |
| Brand website | Exploring seriously | Product views, return visits |
| Search/direct visit | Acting on existing intent | Branded search, conversion |
In practice, this means reading engagement across the journey and looking for signals of influence beyond the platform that happened to capture the final click.
What Does an Engaged Audience Actually Look Like?
Whether it’s a three-second video view, a saved article or a completed purchase, all three actions fall under engagement. With completely different audience journeys, it can be difficult to discern what an engaged audience looks like.
We find it helps to picture audience response as a progression:
- Exposure means the opportunity existed. The ad appeared on screen, the sponsored recommendation was served or the brand appeared in a piece of content.
- Attention is the first sign the opportunity went somewhere. The person watched enough of the video to absorb the message, spent time with the content or had the placement in view long enough to notice it.
- Interaction leaves a clearer footprint: a click, swipe, scroll, share, save or another deliberate action.
- Intent shows up when interest survives the first encounter. Product-page exploration, branded searches, repeat visits and a return to an offer first found elsewhere all belong here.
- Action is the outcome the campaign was built for, whether that is a signup, a lead, a download or a purchase.
The most useful thing this model gives you is the place where the audience stops moving. Huge reach with poor viewability points to a placement problem. Strong attention followed by almost no interaction sends you to the creative and the message. Plenty of clicks followed by instant exits put the landing page under the spotlight.
The campaign goal determines which stage deserves the most attention and, in turn, which KPIs are actually worth tracking. For a brand-awareness campaign, strong attention or a later rise in branded search can be considered a success.
When Engagement Metrics Lie
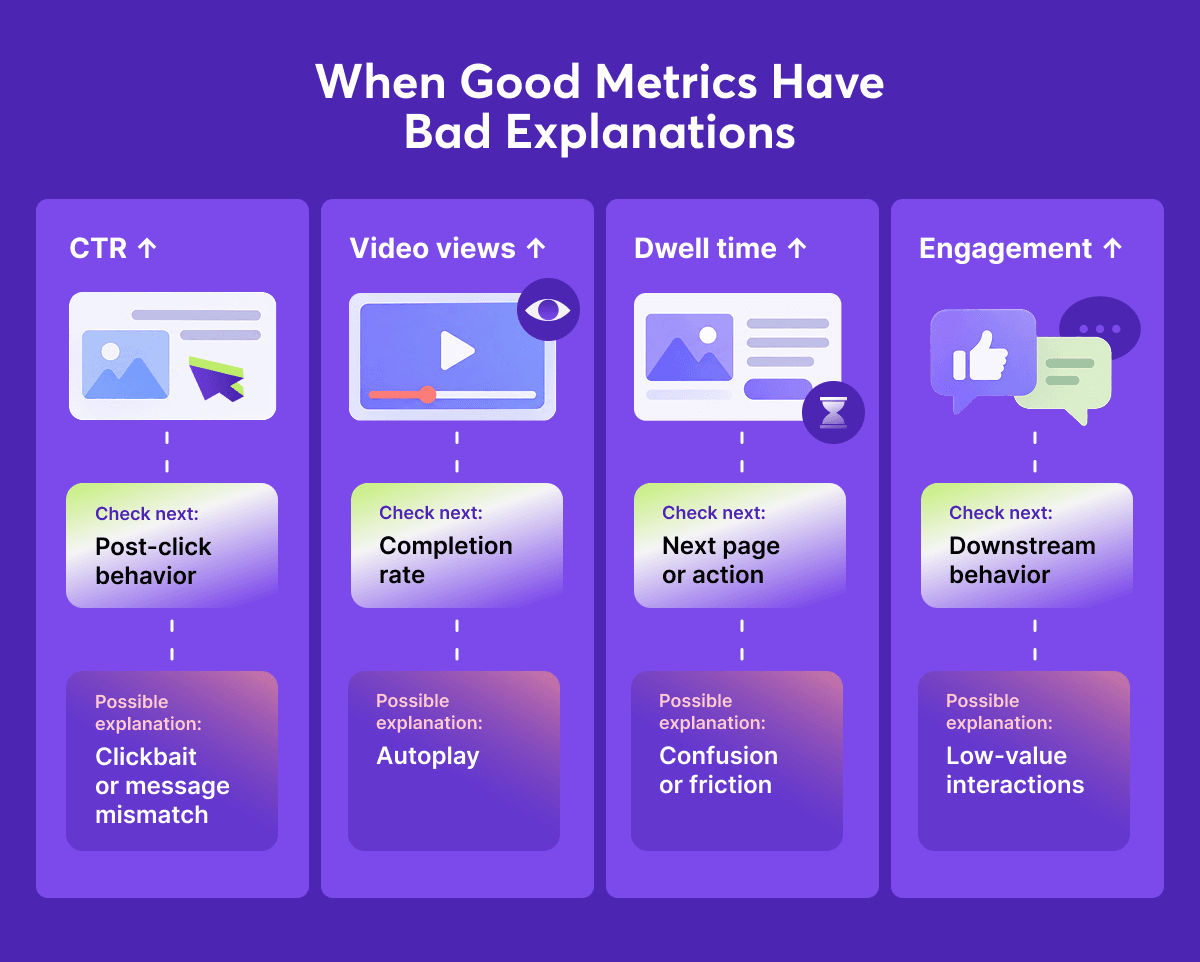
A click may indicate true interest, but that’s not necessarily the case. Engagement metrics can have conflicting realities.
Consider if people clicked, did they explore? If they watched, did they stay long enough to take the message in? If they read, did they come back, search, subscribe or take another relevant step? To understand the true reality of your engagement metric, look at what happened after the metric was counted.
- High CTR + instant exits: The creative won the click and the landing page lost the visitor within seconds.
- Thousands of video views + low completion: Autoplay did the heavy lifting but not much else.
- Lots of likes + no further activity: People enjoyed the post and moved on to the next thing.
- Strong dwell time + no progression: Real interest, confusion and a painfully slow page all burn minutes in exactly the same way.
The same mechanism sits behind many of these numbers. Once a metric becomes a target, someone finds the cheapest way to earn it. Autoplay earns views, clickbait earns clicks and intrusive placements can manufacture interaction.
A metric earns its place in the report when the behavior behind it connects to the campaign goal. If it doesn’t, it probably belongs in the appendix.
Where the Message Appears Changes Its Value
The same ad meets a different audience depending on what surrounds it. Take an ad for a home espresso machine. One person sees it while reading a guide to choosing coffee beans. Another sees it between two unrelated posts while scrolling half-asleep before bed. While both impressions land in the same report, the context and circumstances behind the encounters heavily influences how much attention it gets.
People also borrow confidence from the sources they use to research a purchase. Publishers explain. Reviews compare. Creators demonstrate. Communities are especially good at pointing out the flaw that somehow escaped the product page.
AI has not pushed affiliate and product-review sites out of discovery. Research presented at Awin’s ThinkTank Americas found that affiliate sites made up 52 of the 100 domains most frequently retrieved by large language models, while product-review and affiliate sites represented 38% of the top 100 domains for “best product” queries.
That gives content environments a bigger role. A useful article, a relevant recommendation or a well-placed native ad can reach someone who is already exploring the subject, and the message gets a far better starting point for attention.
Before chasing another million impressions, check three things:
- Context: What is the audience doing when the message appears?
- Relevance: Does the creative belong in that moment?
- Next step: Is there somewhere useful for that interest to go?
Context cannot guarantee attention, but the ad can work considerably less to earn attention with it.
How to Find Your Engagement Gap
An engagement gap leaves clues. The first sign of an engagement gap comes when healthy numbers suddenly turn disappointing. From there, the diagnosis is half done.
| If you see... | The gap may be... | Look at... |
|---|---|---|
| High reach → low viewability | People are counted without getting a real chance to notice the ad | Placement, format, page position, load time |
| Strong viewability → weak interaction | The ad is on screen and the message is not landing | Creative, headline, audience fit, context |
| Good CTR → high bounce/quick exits | The promise earned the click and the destination could not keep it | Message match, landing page, load speed |
| Good engagement → weak conversion | Interest is there and something blocks the way to action | Offer, UX, form length, price, trust signals |
| Conversions → poor business value | The campaign is producing action from the wrong people | Lead quality, repeat purchases, LTV, targeting |
A 4% CTR sounds excellent until you learn that 90% of those visitors left within seconds. A huge reach figure loses its shine when most of those impressions never become viewable. The break between two metrics often tells you more than either metric on its own.
In multichannel campaigns, the same exercise can show what each channel actually contributes. One may introduce the brand, another drives deeper exploration and a third captures demand that has already formed.
Follow the audience far enough to see where interest grows, where it stalls and where it becomes something the business values.
Turn Engagement Into Something You Can Optimize
Finding the weak spot is useful only if the campaign can show what happens around it. That makes post-click data particularly valuable. Without it, a click is simply a click.
MGID’s engagement metrics, for example, show advertisers what happens after traffic reaches the landing page, including visits and time on site. A click that turns into real exploration and a click followed by an instant exit finally look like the different events they are.
Context gives advertisers another lever earlier in the journey. MGID’s contextual targeting uses page content and contextual signals to help match ads with relevant environments.
Start with the break point. Fix what is losing people there before pushing more traffic through the same journey.
The Missing Half of the Reach Equation
A strong reach figure deserves a proud place in the report. Although, what’s useful tends to be what happened after reach was counted. Did they stay, explore, return, search for the brand or act intentionally?
Those signals make next steps more identifiable. Scale what works, fix the point where interest drops or rethink the experience before sending more people through it. Extra reach poured into a leaky experience only makes the leak bigger.