MGID is excited to announce Engagement Metrics, our newest feature that helps advertisers understand what happens after users click on their ads.
Clicks and conversions only tell part of the story. Engagement Metrics go deeper, revealing how users actually interact with your website: how long they stay, how much they engage and how valuable that attention is.
What Engagement Metrics Are
Engagement Metrics track real user behavior once visitors land on your site. They measure not only traffic but also true engagement quality.
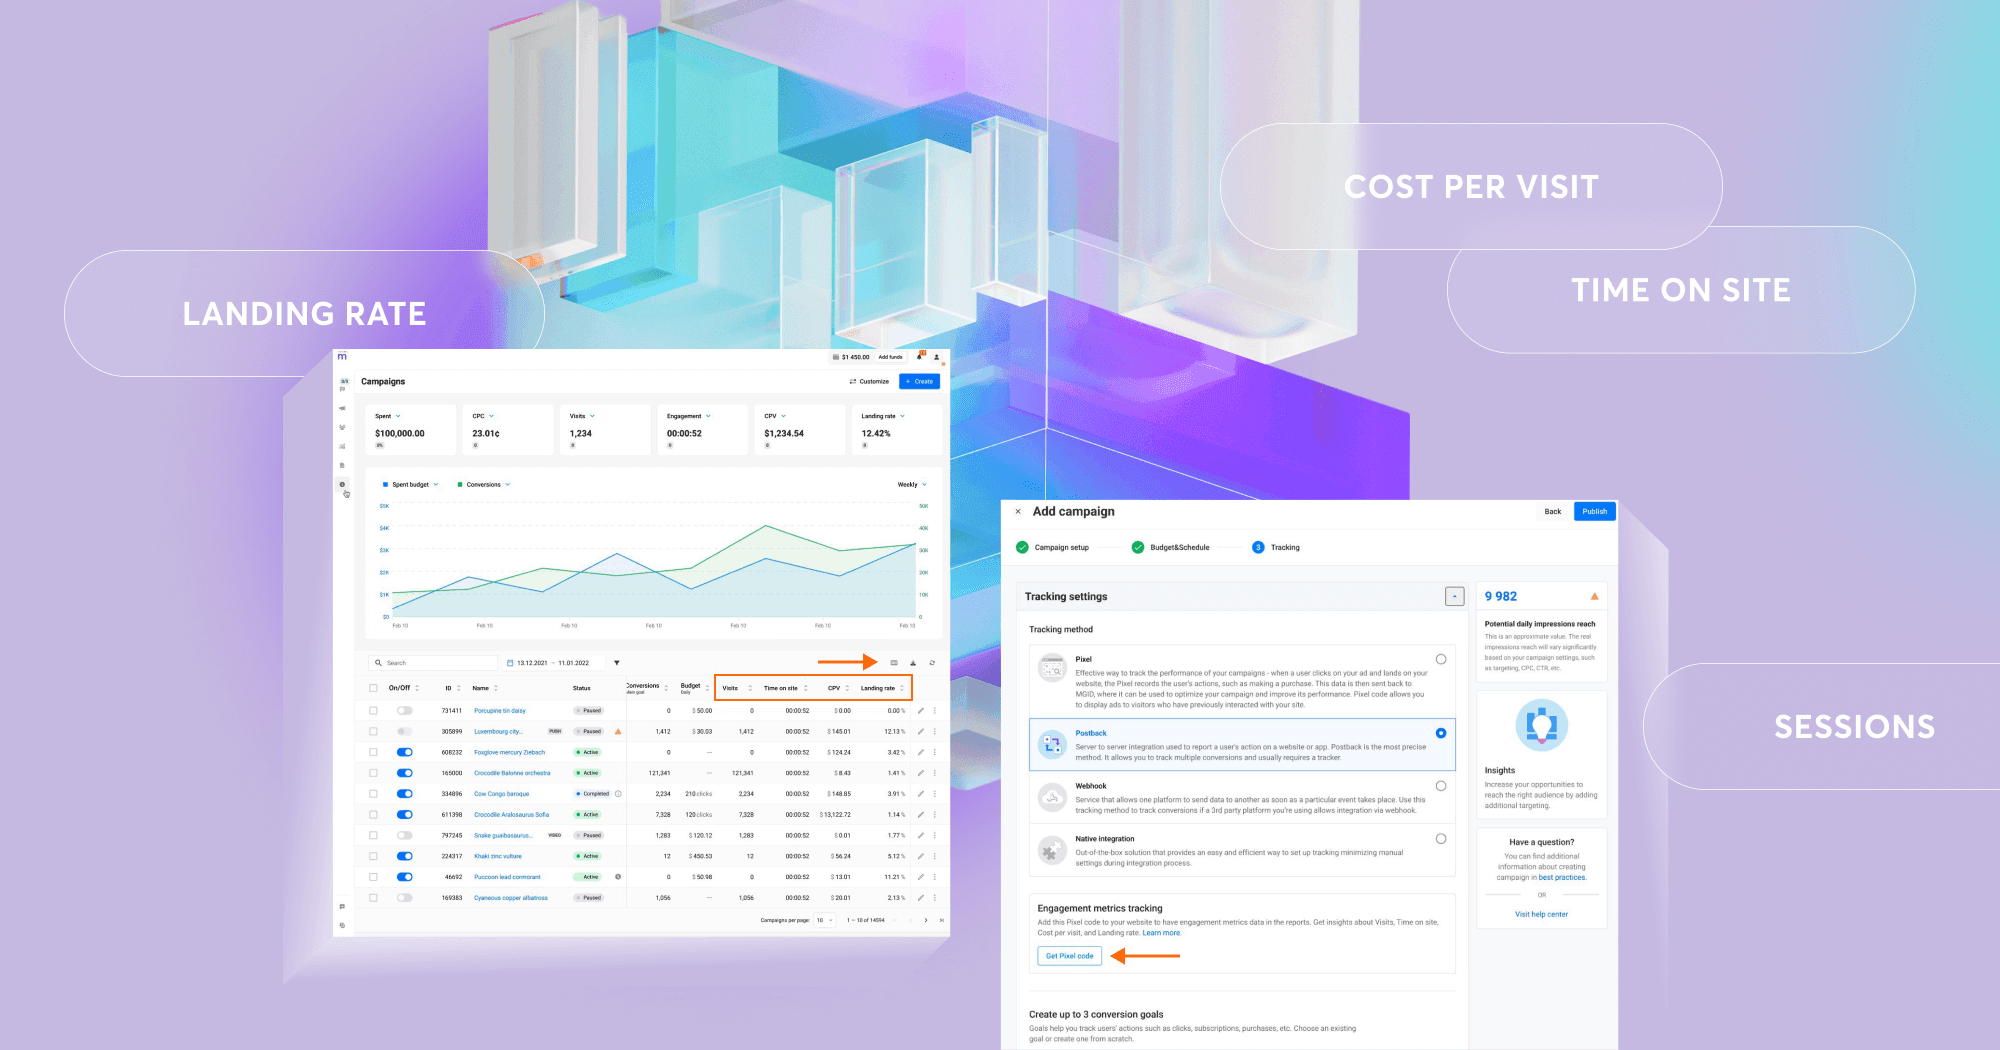
You’ll now see:
- Visits (Sessions): A visit is counted every time a user lands on your landing page after clicking an MGID ad. Each visit represents one real user session, tracking how many genuine site interactions your campaign brings in.
- Time on site: This shows how long users actually spend on your pages on average. It only counts active time, when the browser tab is visible and in focus, so you see true engagement.
- CPV (Cost per visit): This metric helps you understand efficiency: how much you pay, on average, for each actual visit. It makes it easy to compare performance across creatives, placements or audiences.
- Landing rate: It shows what percentage of ad clicks actually lead to a page load on your website. A high landing rate means traffic is reaching your site smoothly. A low one could signal technical issues, a slow page load or audience mismatch.
Why Engagement Metrics Matter
Engagement Metrics fill the gap between clicks and conversions and meet several key needs.
- Better understanding of user behavior: Advertisers can now see how users actually engage with their content.
- Improved campaign optimization: With deeper insights, managers can make smarter decisions and improve ROI.
- Qualitative data for brand campaigns: Brands often measure awareness and content effectiveness, and these metrics make that possible.
How Engagement Metrics Work
The MGID Pixel you already know now does even more. Once placed on all pages of your website, it automatically tracks engagement with no extra setup required.
Here’s what happens behind the scenes:
- When a user clicks an MGID ad and lands on your site, the Pixel starts a new session.
- It tracks how long the user actively views your pages (only when the tab is in focus).
- If the user navigates through multiple pages with Pixel on them, the session continues.
- After 30 minutes of inactivity, or when another click happens, a new session starts.
- All engagement data (time on site, visits, landing rate, etc.) is automatically sent to MGID.
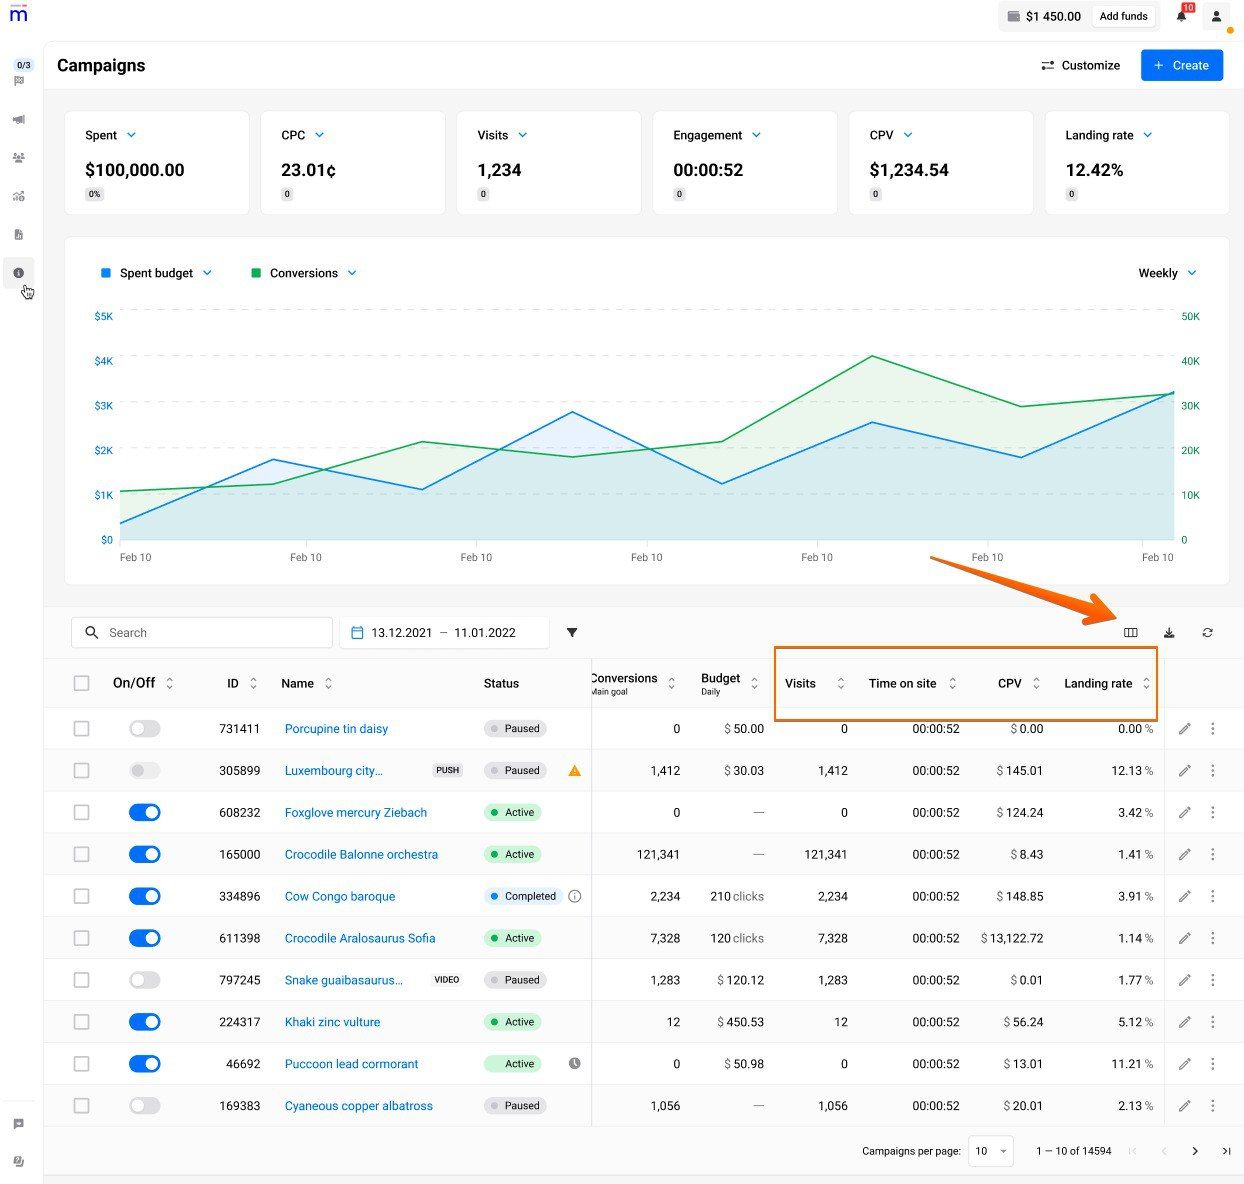
You’ll then see this data directly in your statistics, available in Campaigns, Ads, Sources and Reports. You can view trends over time, add engagement columns to your table or compare different creatives and traffic sources.
How to Enable Engagement Metrics
It’s simple:
1. Go to your campaign setup or edit flow.
2. Open the Tracking tab and click Get Pixel Code.
3. Copy the code and place it on all pages of your website, high in the section (or via Google Tag Manager).
4. In your dashboard, use the column picker to add Visits, Time on Site, Landing Rate or CPV, and your data will start appearing automatically.
No extra settings, no extra setup. Once the Pixel is active, Engagement Metrics begin collecting data right away.
Start Measuring What Really Matters
Clicks are only the beginning. Engagement Metrics help you see the bigger picture: how users actually interact with your site, how engaged they are and how effective your content really is. With these new insights, you can optimize smarter and make better decisions based on genuine user behavior.
Engagement Metrics are now available on the MGID dashboard: add them to your reports today and start seeing beyond the click.